 Overview


Complex maths and algorithms have become deeply embedded in financial decision making. But, while the rabbit hole of quantitative analysis runs deep, they are by no means impossible for non-specialists to navigate. Many quant models are straightforward. They’re a tool to enhance human decision-making, rather than replace it, helping investors make good decisions, and avoid bad ones.
Quantitative models can provide a structured process for making and implementing decisions, away from the pitfalls of behavioural biases. But any system is only as good as the rules that govern it.
There are three types of fixed income model
First, a bit of background. Quantitative models can be used for investment decisions, portfolio construction, and risk management. The vast majority of fixed income portfolio managers will use some degree of quantitative input depending on the mandates they manage and their personal style. Our fixed income team has developed a suite of models to help decision making in the strategies we manage. They fit into three categories:
- The first group includes duration, curve, cross-market and cross-currency models. These models can act as an overlay for both active and non-active strategies. They cover only one asset class and offer precisely controlled exposure to a specific risk. Such models are typically implemented through derivatives so they require low levels of capital and are highly liquid. Portfolio managers assign a risk budget and can then implement the strategies or take profit with relative ease.
- The second group includes credit models designed to recommend either an appropriate level of credit beta by looking at credit sentiment and fundamentals or the selection of individual securities. They can also operate on both active and non-active strategies and incorporate quantitative signals, analyst research, valuations and fundamental studies. This group of models generally provides slower moving indicators than the other two groups.
- This article will focus on the third group of models, which guide asset allocation decisions within the fixed income universe. Our asset allocation model sits above the other two types of model, using the output of each. Using asset allocation models is highly dependent on the mandate in question being cross-asset class. As such, these models cannot be implemented as a derivative overlay.
Using quant models for asset allocation
The chart below gives an example of the asset allocation scorecard we use at Fidelity. Due to its broad scope, the inputs of the scorecard include the outputs of a number of models with a narrower focus, individual quantitative signals and qualitative input from portfolio managers, analysts and traders. The split is around 80 per cent quantitative input and 20 per cent qualitative. This enhances the investment process and gives us a more complete view than using either on their own.
Quantitative models help to process large amounts of data and highlight what is important. The qualitative inputs provide an intelligent filter to the quantitative signals. For example, even the most sophisticated economic models of growth and inflation expectations can be wrongfooted by the rotation of members on a rate-setting committee. Whether Federal Reserve Chairman Jay Powell is more comfortable over or undershooting inflation targets than his predecessor is hard to quantify and is not represented in historical data. Yet these distinctions might be crucial in deciding the future path of US rates. Recognising that algorithms and humans excel at solving different types of problems produces a more robust tool.
Chart 1: The asset allocation model with example numbers
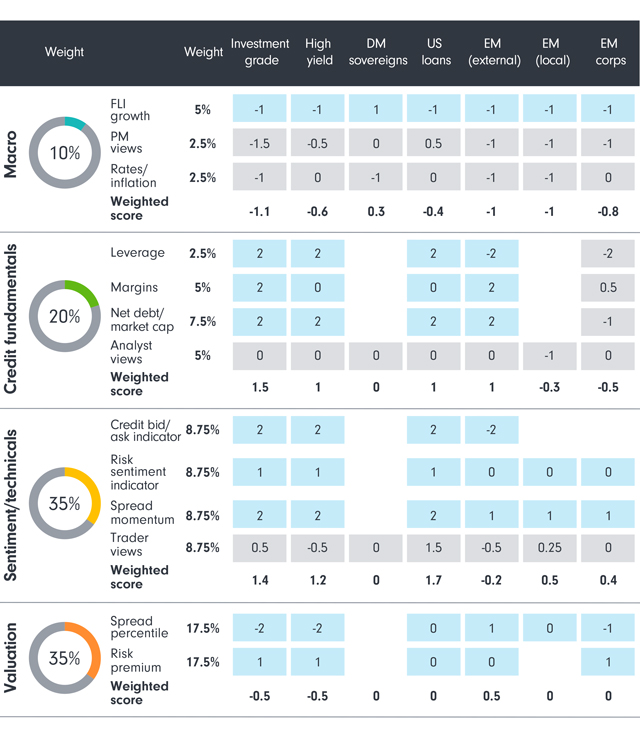 Grey shading denotes qualitative inputs, blue shading denotes quantitative inputs. For illustrative purposes only
Source: Fidelity International, September 2018.
Grey shading denotes qualitative inputs, blue shading denotes quantitative inputs. For illustrative purposes only
Source: Fidelity International, September 2018.Our asset allocation model has four pillars:
- The macro pillar includes inputs from quantitative models focused on expected inflation rates, data from the Fidelity Leading Indicator model which forecasts economic growth and qualitative input from portfolio managers.
- The fundamentals pillar is made up of the output of our credit conditions model which includes earnings and leverage expectation models, as well as net debt to market cap and qualitative information from analysts based on company meetings.
- The sentiment pillar measures risk appetite. Inputs include credit bid/ask spreads, spread momentum and a risk sentiment index which gives an indication of how positive we should be about the credit market in general. This pillar also includes a near term view from traders on the performance of their sector based on what they know about supply and demand conditions, positioning, and risk appetite.
- The valuation pillar features the purely quantitative inputs of spread percentile and risk premium.
Each input arrives as a normalised score, and is then truncated between -2 and +2, and rounded to the nearest 0.5 to make the scorecard easier to read. Inputs are weighted based on their information ratios so that the signals that have the most value contribute the greatest weight to the final score. The information ratio measures risk adjusted excess return over a benchmark and gives an indication of the alpha generation track record of each indicator.
If you want a useful model, start with a good design
The model is constructed with a lookback period similar to our clients’ investment horizons, currently set at ten years This has been the source of some debate recently as the financial crisis will soon drop out of the sample data. We have taken the decision to carry on including this period in our calculations for the time being as we feel that events and market conditions around that time are still useful for guiding allocation in the current environment.
The model is designed to be sensitive to conditions that precede large risk-off events. A relatively high weighting is placed on momentum, and the sentiment pillar of the scorecard is designed to react quickly to changing events. As a result, the asset allocation recommendation of the model adapts quickly to volatile environments and we expect the scorecard to perform strongly in this sort of market backdrop.
This approach does have limitations. A sudden spike in volatility due to an idiosyncratic event, such as in Argentina or Italy earlier this year, can cause the model to reallocate quickly only for the broader market to revert to business as usual in short order. The scorecard is designed to accept small losses around these events as the price of being favourably positioned for a more widespread pull-back in credit conditions.
Using the model in practice
The model produces a combined normalised score for each asset class. A positive number signifies an overweight recommendation and a negative number an underweight recommendation.
While the model is a key part of the investment process, we prefer to use its recommendations as a framework for debate rather than a rigid allocation formula. The model identifies positions that require greater scrutiny and highlights priorities for further analysis. It can confirm an analyst’s call or raise a flag that a view needs to be questioned. Almost as important as the absolute numbers are the weekly changes to the scores. The model can help us assess how the investment environment is changing and what that means for our portfolio, as well as what that implies about the broader credit cycle.
Does the model work?
As you can see from Chart 2 below, the asset allocation scorecard performs well overall, as shown by the positive information ratios. But the results also reveal that the scorecard performs better for some asset classes than others. High yield, US loans and emerging market corporate debt are areas the model has predicted particularly well since we started using it in 2014.
Chart 2: The asset allocation model has performed well
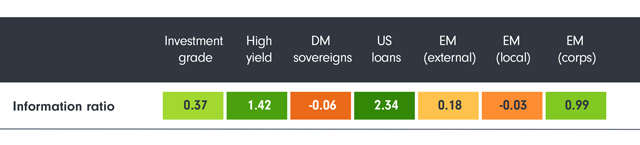 Information ratios calculated January 2014 - May 2018. Source: Fidelity International, August 2018.
The model has performed less well in developed market sovereigns and local currency emerging market debt. The more an asset class is dominated by default risk rather than duration risk, the more chance there is to achieve a higher information ratio by timing the risk appetite of the markets. This goes some way to explain the difference between the information ratios of high yield and investment grade bonds - though the real out-of-sample proof will come with the next major recessionary downturn in credit markets.
Currently the model is tilted towards risk assets
At the moment, investment grade corporate debt, high yield bonds and US loans all get an overweight recommendation (see Chart 3). The macro pillar is negative for all asset classes except developed market sovereigns. This is due to the Fidelity Leading Indicator signalling a broad slowdown in economic activity which should increase demand for safe-haven assets at the expense of bonds that have higher volatility and are more correlated with growth.
However, bullish sentiment and fundamental scores currently outweigh the negative macro outlook and poor valuations to leave our asset allocation tilted towards riskier assets in developed markets. All flavours of emerging market debt receive an underweight recommendation from the model thanks to negative credit momentum, seasonality and a challenging liquidity environment.
Chart 3: The model is currently recommending an underweight position emerging market debt
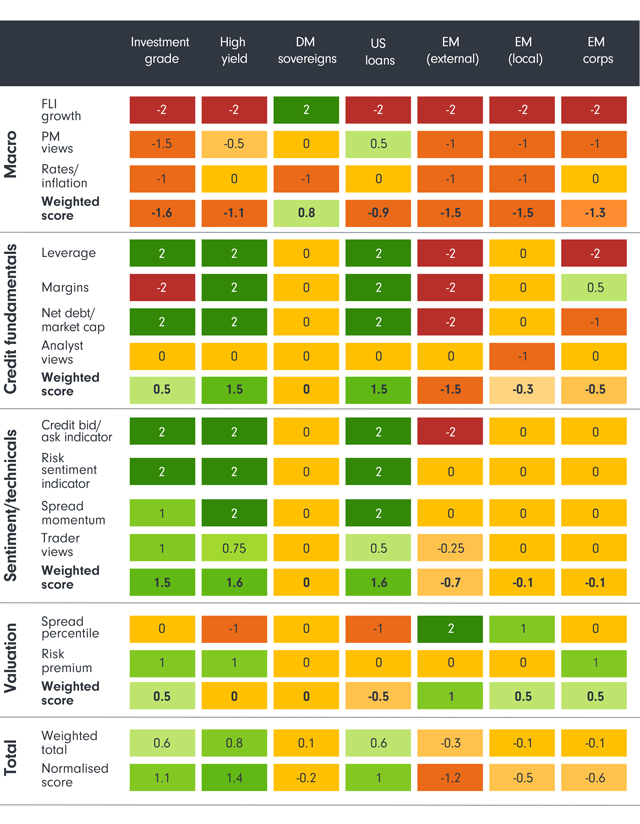 Source: Fidelity International, August 2018.
Negative swing for hard currency EMD sovereigns
The output of the model has been stable since April this year except for external currency emerging market debt. The model had been recommending a solid overweight since last summer, until it abruptly switched to underweight at the end of May.
The reasons for the move can be found in the macro, sentiment and fundamental pillars of the model. The macro outlook for emerging markets has worsened this year. Growth is slowing, surprises have been negative. and there is much talk of when the current global economic cycle will roll over and whether 2017 was as good as it gets.
Source: Fidelity International, August 2018.
On the fundamental side, emerging markets have broadly experienced a deterioration of their fiscal balances despite the strength of the oil price this year. US tax cuts haven’t helped the situation, but it is also the result of less responsible fiscal policies. Brazil, for example, has a debt-to-GDP ratio that has been pushing higher and now stands at 74 per cent compared to 52 per cent as recently as 2013.
Sentiment has also taken a turn for the worse in the last few months as momentum has turned negative and volatility has risen. Some of this is due to idiosyncratic risks in countries such as Argentina, Indonesia and Turkey, but investors are also nervous about the implications of further US rate hikes. Emerging market sovereign debt is typically significantly longer duration than corporate high yield bonds, often for the same credit rating, making these bonds less attractive in a rising rate environment.
Time to increase quality
We think the asset allocation scorecard gives a fair depiction of the current state of the market. The model is not yet predicting an imminent economic downturn - the macro pillar is negative for growth but credit fundamentals and sentiment are still broadly positive. However, the scorecard doesn’t tell the greatest of stories for high yield over the medium term. We’re in a rising default environment and investors are not getting adequately compensated in the riskier regions of high yield at current spread levels. This could be the right time to increase the quality of a fixed income portfolio to avoid defaults and to lock in profits, especially given the poor liquidity conditions.


